Maht 539 lehekülgi
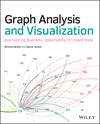
Graph Analysis and Visualization
Raamatust
Wring more out of the data with a scientific approach to analysis Graph Analysis and Visualization brings graph theory out of the lab and into the real world. Using sophisticated methods and tools that span analysis functions, this guide shows you how to exploit graph and network analytic techniques to enable the discovery of new business insights and opportunities. Published in full color, the book describes the process of creating powerful visualizations using a rich and engaging set of examples from sports, finance, marketing, security, social media, and more. You will find practical guidance toward pattern identification and using various data sources, including Big Data, plus clear instruction on the use of software and programming. The companion website offers data sets, full code examples in Python, and links to all the tools covered in the book.
Science has already reaped the benefit of network and graph theory, which has powered breakthroughs in physics, economics, genetics, and more. This book brings those proven techniques into the world of business, finance, strategy, and design, helping extract more information from data and better communicate the results to decision-makers.
Study graphical examples of networks using clear and insightful visualizations Analyze specifically-curated, easy-to-use data sets from various industries Learn the software tools and programming languages that extract insights from data Code examples using the popular Python programming language There is a tremendous body of scientific work on network and graph theory, but very little of it directly applies to analyst functions outside of the core sciences – until now. Written for those seeking empirically based, systematic analysis methods and powerful tools that apply outside the lab, Graph Analysis and Visualization is a thorough, authoritative resource.


